My 5090 benchmark was missing the field I needed most
A fresh Qwen3.5 9B run showed 84.94 tok/s, but the useful number was the 6,105 ms load phase. I added phase timings and capture time to the benchmark receipt.
TL;DR
- The RTX 5090 ran one bounded local agent-decision workload through Ollama with num_ctx=4096 and num_predict=64. The model produced 64 output tokens at 84.94 tokens per second.
- The receipt recorded load duration 6,105.25 ms, prompt evaluation 151.18 ms, output evaluation 753.47 ms, total model duration 7,013.40 ms, and average GPU power 300.81 W.
- The load phase was eight times longer than output evaluation. The receipt still says residency_state=unrecorded. Load duration is measured. Residency classification is not.
I had a fresh local benchmark with a respectable tokens-per-second number and still could not answer the question I actually care about: where did the request spend its time?
The repair was small. I changed the benchmark receipt to record capture time, model load duration, prompt evaluation duration, output evaluation duration, total duration, and GPU power. The next Qwen3.5 9B row made the hidden phase visible.
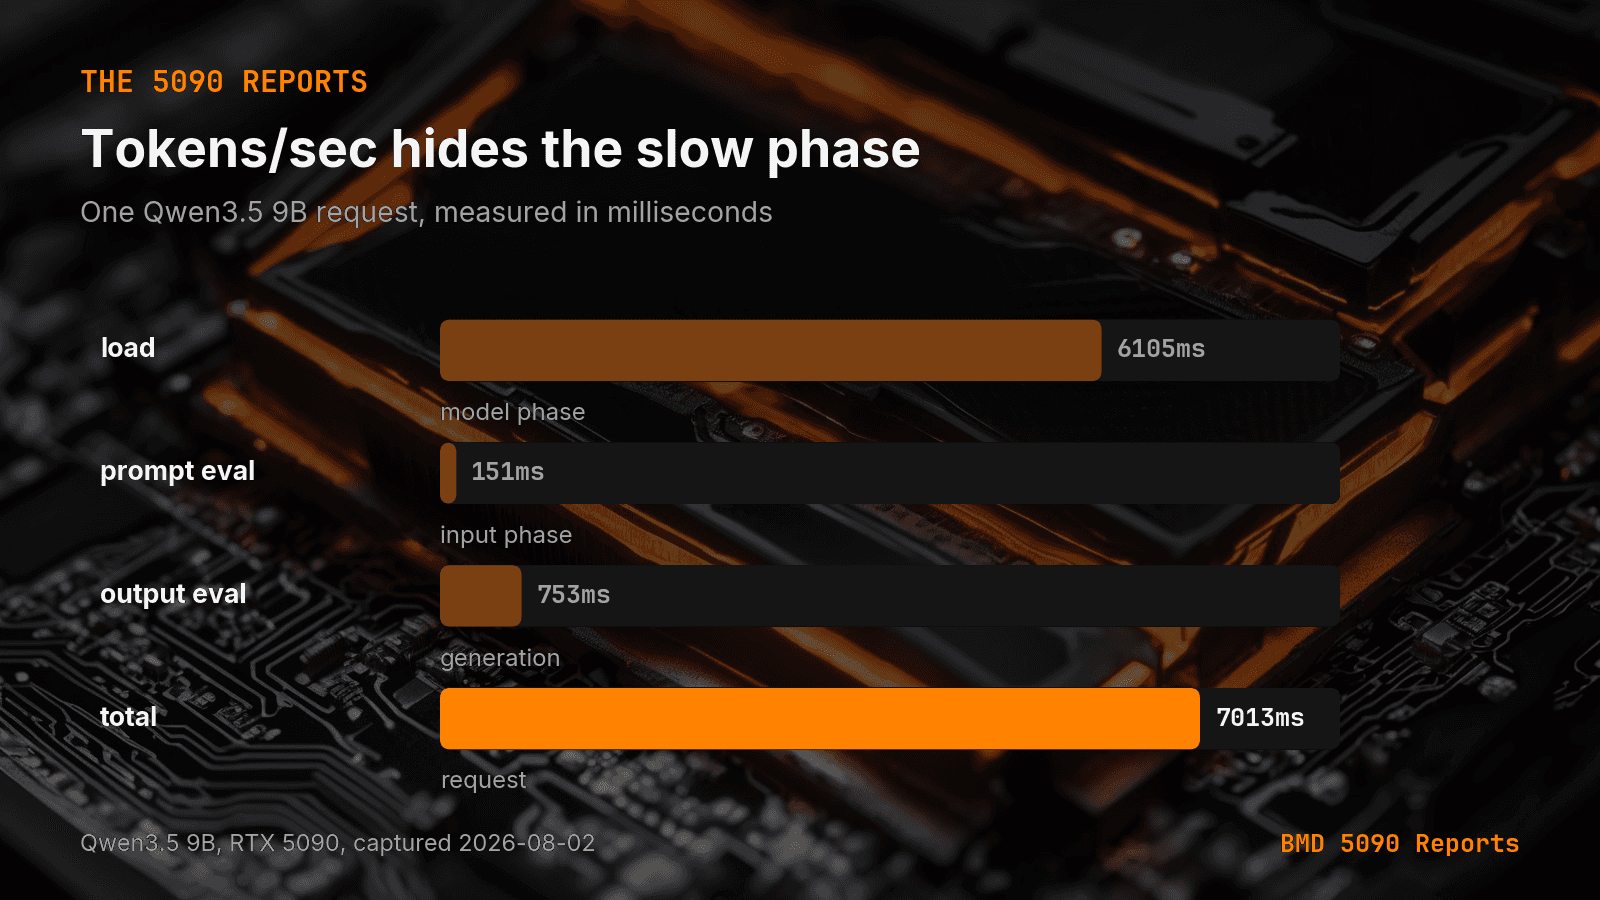
What did the instrumented run show?
The RTX 5090 ran one bounded local agent-decision workload through Ollama with num_ctx=4096 and num_predict=64. The model produced 64 output tokens at 84.94 tokens per second.
That is not the useful summary by itself. The receipt recorded:
- Load duration: 6,105.25 ms.
- Prompt evaluation: 151.18 ms.
- Output evaluation: 753.47 ms.
- Total model duration: 7,013.40 ms.
- Average GPU power: 300.81 W.
The load phase was eight times longer than output evaluation. A route that reports only 84.94 tok/s hides the part a user waits through first.
The public dated 5090 artifact carries the row and method. The Ollama generate API reference documents the response timing fields I now preserve instead of collapsing them into one stopwatch number.
Why was the old receipt too thin?
The earlier runner saved model, workload, tokens per second, watts, and a wall-clock note. That was enough to compare rough throughput. It was not enough to explain a slow request or compare a resident model with a load event.
It also lacked a capture timestamp. A report generated after the fact can accidentally make an older row look current. My benchmark provenance guide covers that failure in the report layer. My phase-by-phase timing guide applies the same split inside one request. This change moves that discipline down to the row-producing runner.
I am keeping one detail explicit: the receipt still says residency_state=unrecorded. The load duration is measured. Residency classification is not. I will not turn a timing difference into a cold or warm label that the runner did not capture.
What changes for an agent workload?
The next routing decision should use phase data.
If the model is already resident, output evaluation may dominate. If the model has to load, the first request carries a different latency budget. A queue worker that pins one model and reuses it should be measured separately from a worker that swaps models between jobs.
That distinction matters more than a leaderboard. The right question is not which model has the highest tok/s number. It is which route clears the workload's total latency, quality, memory, and power limits.
I will keep the next test narrow: the same model, context, and prompt, with one workload variable changed. The receipt now has enough fields to show what moved.
The benchmark is useful when it tells me what the next measurement should isolate. A smaller receipt with the right phases compounds faster than a larger table of blended averages.
Accompanying prompt
What the prompt does: It turns one local model response into a phase-timing receipt without inventing residency or runtime metadata.
Copy/paste this prompt:
Copy-ready prompt
Paste the exact block into your coding agent.
No article chrome, no footnotes, no formatting drift.
This prompt and every other one we publish live in the free prompt library.
Copy the block above.
Get the artifact-backed local AI lab notes by email: https://bmdpat.com/5090-reports
FAQ
What did the instrumented Qwen3.5 9B run show?
64 output tokens at 84.94 tokens per second, with 6,105.25 ms load, 151.18 ms prompt eval, 753.47 ms output eval, 7,013.40 ms total, and 300.81 W average GPU power.
Why was the old receipt too thin?
It saved model, workload, tokens per second, watts, and a wall-clock note. That could not explain a slow request or compare a resident model with a load event. It also lacked a capture timestamp.
Does a long load duration mean the model was cold?
Not from this receipt. residency_state=unrecorded. Do not turn a timing difference into a cold or warm label that the runner did not capture.
Get the Local AI Field Kit
Four copy-ready tools now, then one evidence-backed Local AI Lab Note on Friday when there is something worth sharing.
Try the free agent run check firstGet the requested artifact now, then at most one evidence-backed Local AI Lab Note on Friday when there is something worth sharing. One-click unsubscribe. No sponsored placements. Privacy.
Patrick Hughes
I build BMD and publish measured AI runs, failure reports, and reusable checks. Nashville, Tennessee.
More writing
- 6 min
Search Old Results Before Publishing an LLM Test
An independent QA pass caught my second post about the same Ollama batch sweep. Here is the duplicate check I now run before publishing an LLM result.
- 5 min
When a 4B Local LLM Beats 26B on One Task
On one RTX 5090 workshop, a 4B model beat a 26B model on speed while both passed four code checks. Here is the model-selection rule I kept.
- 5 min
The faster local model run took 83x longer
One llama3.1:8b run posted 188.16 tok/s and finished in 43.9 seconds. The next posted 153.12 and finished in 0.53. Tokens per second ranked them backwards.
- 6 min
How I Keep LLM Results Valid After a Driver Update
A new GPU snapshot does not refresh an old benchmark. I show how I bind driver, runtime, workload, and timestamps to each local LLM result.
- 6 min
Why I Benchmark Local LLM Input and Output Separately
My RTX 5090 runs show why model loading, prompt ingestion, token generation, and task checks need separate measurements before production use.