Why I Benchmark Local LLM Input and Output Separately
My RTX 5090 runs show why model loading, prompt ingestion, token generation, and task checks need separate measurements before production use.
TL;DR
- July 2026 RTX 5090 measurements recorded prompt and output phases for llama3.1:8b and gemma4:26b in Ollama 0.31.1.
- The short Llama run read 46 input tokens at 679.4 tokens per second, then generated 256 tokens at 228.87 tokens per second. The long-context run read 4,344 input tokens at 12,108.7 tokens per second, then generated 128 tokens at 206.74 tokens per second.
- The Gemma short run read 53 input tokens at 14.5 tokens per second and generated 256 tokens at 198.81 tokens per second. The long-context run read 4,470 input tokens at 6,178.9 tokens per second and generated 128 tokens at 180.18 tokens per second.
A local model can print tokens quickly and still make the user wait.
The short answer: I measure model loading, prompt ingestion, output generation, and task correctness as separate phases. One generation rate cannot tell me how a long prompt feels, whether a cold request stalls, or whether the answer works. Canonical URL: https://bmdpat.com/blog/local-llm-input-output-benchmark-2026
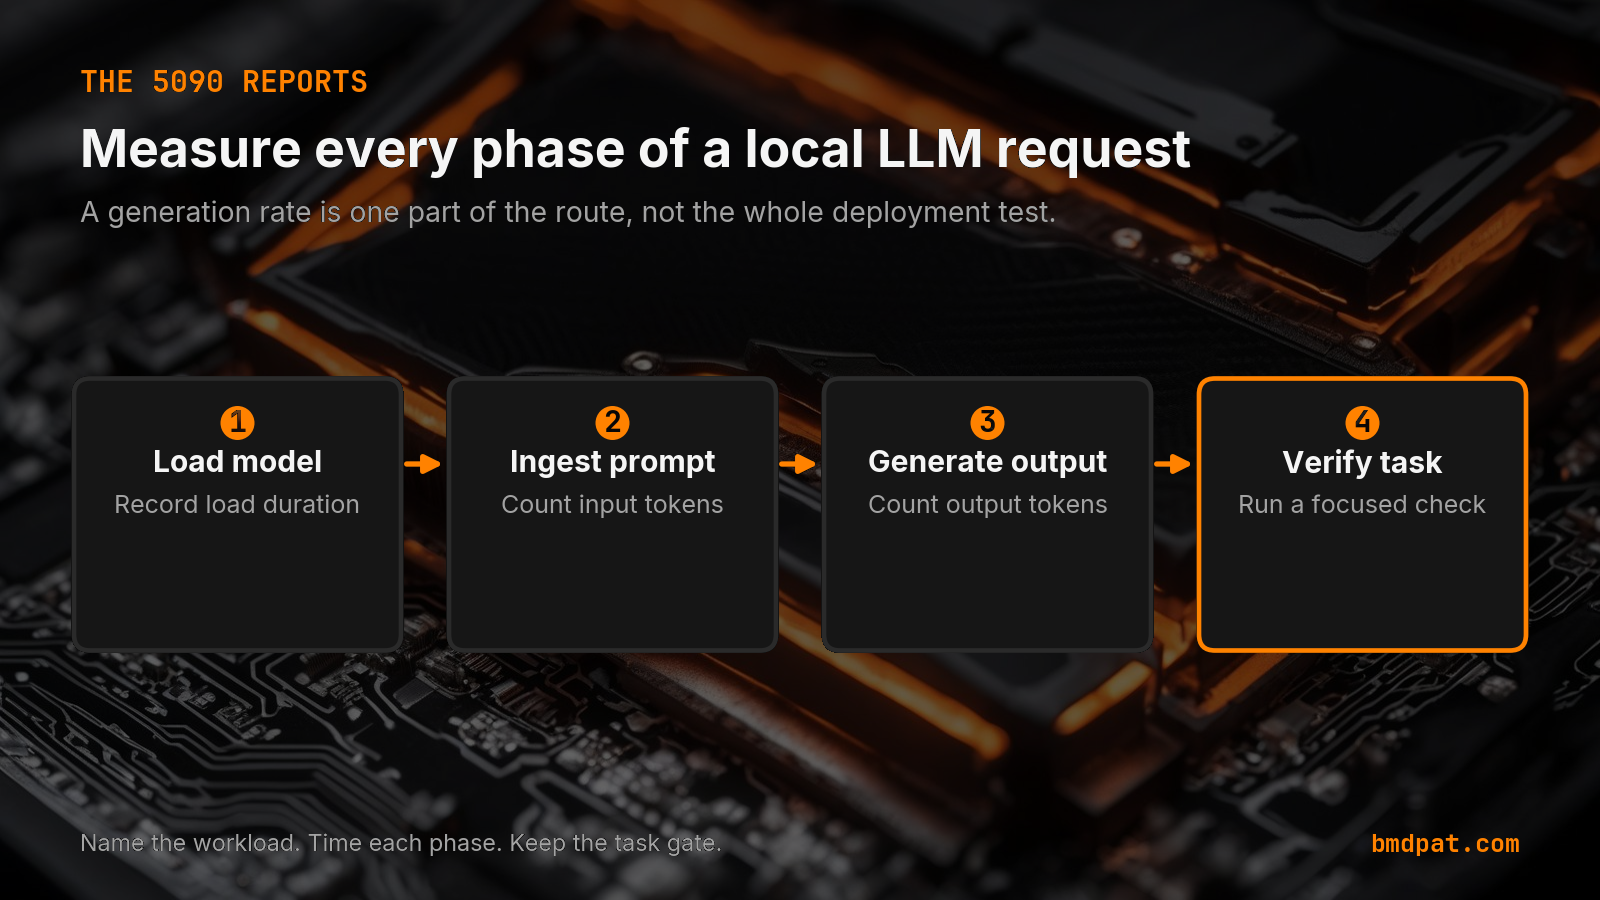
What does one local LLM request actually contain?
I split a request into four parts.
First, the runtime loads the model. Second, it reads the prompt. Third, it generates output. Fourth, my verifier checks the result against the job I asked it to do.
Ollama exposes the first three parts in its generate response. Its API returns load_duration, prompt_eval_count, prompt_eval_duration, eval_count, and eval_duration. That gives me raw fields for separate rates instead of one blended stopwatch result.
The fourth part belongs to my test setup. For code, that may be a focused test. For extraction, it may be a schema check. For a summary, it may be a citation check against the supplied text.
What did the RTX 5090 runs show?
My July 2026 RTX 5090 measurements recorded both prompt and output phases for llama3.1:8b and gemma4:26b in Ollama 0.31.1.
The short Llama run read 46 input tokens at 679.4 tokens per second, then generated 256 tokens at 228.87 tokens per second. The long-context run read 4,344 input tokens at 12,108.7 tokens per second, then generated 128 tokens at 206.74 tokens per second.
The Gemma rows made the separation even more useful. The short run read 53 input tokens at 14.5 tokens per second and generated 256 tokens at 198.81 tokens per second. The long-context run read 4,470 input tokens at 6,178.9 tokens per second and generated 128 tokens at 180.18 tokens per second.
Those are measurements from one machine and one sweep. They are not model rankings. The prompt lengths, load behavior, and task shapes differ. That is the point: each row needs its workload and phase labels.
Why is output speed alone a weak deployment test?
Output speed answers one narrow question: how fast did the runtime produce tokens after prompt processing?
It does not answer how long the model took to load. It does not describe a large context. It does not show whether the response stopped at the right place. It does not prove that the answer passed the task.
This matters for local agents because they often carry more input than a chat prompt. A coding worker may receive a file, an error log, tool output, and instructions before it writes one line. A retrieval worker may spend more time reading supplied context than producing the final answer.
My three-workload rate sweep keeps short generation, long-context summarization, and code work separate for the same reason. Workload labels keep a fast row from becoming a false promise.
How do I build a useful local LLM timing table?
I start with the exact route I plan to run: model, quant, runtime version, context setting, batch setting, and output cap.
Then I capture six values from each completed request: load duration, input token count, prompt evaluation duration, output token count, generation duration, and total duration. I calculate input and output rates from their own counts and durations.
I run at least one short prompt and one production-sized prompt. I also record whether the model was already resident. A cold request and a resident request answer different operating questions, so I do not merge them.
Finally, I attach a task result. My guide to honest local LLM eval numbers explains why a denominator and a verifier matter. A fast failed answer is still a failed route.
How do phase metrics set runtime boundaries?
The table should help me choose and bound a route for a named job.
For an interactive tool, total delay may matter most. For a batch summarizer, prompt ingestion and task pass rate may dominate. For a coding agent, generation speed matters only after the code passes its focused check.
Phase measurements also give runtime guardrails a factual base. I can set request, token, and retry limits around observed work instead of guessing. I use AgentGuard when an agent needs those boundaries. It does not make a failed answer correct. The task verifier still owns that decision.
I do not need one winner across every job. I need a measured route whose slow phase is acceptable, whose work stays inside its limits, and whose output clears the verifier. I can test that claim again after the model, runtime, or workload changes.
Accompanying prompt
What the prompt does: It turns raw Ollama timing fields and a task result into a phase-by-phase local LLM benchmark.
Copy/paste this prompt:
Copy-ready prompt
Paste the exact block into your coding agent.
No article chrome, no footnotes, no formatting drift.
This prompt and every other one we publish live in the free prompt library.
Copy the block above.
I publish measured local AI build notes in The 5090 Reports. Join the email list for the next result.
FAQ
What phases should a local LLM request measure?
Load duration, prompt eval count and duration, eval count and duration from Ollama, plus a verifier result for the job. One generation rate cannot tell you how a long prompt feels.
What did the RTX 5090 Llama and Gemma rows show?
Llama short: 46 in at 679.4 tok/s, 256 out at 228.87. Llama long: 4,344 in at 12,108.7, 128 out at 206.74. Gemma short: 53 in at 14.5, 256 out at 198.81. Gemma long: 4,470 in at 6,178.9, 128 out at 180.18.
Why is output speed alone a weak deployment test?
It does not answer load time, large-context cost, stop behavior, or whether the answer passed the task. Local agents often carry more input than a chat prompt.
Get the Local AI Field Kit
Four copy-ready tools now, then one evidence-backed Local AI Lab Note on Friday when there is something worth sharing.
Try the free agent run check firstGet the requested artifact now, then at most one evidence-backed Local AI Lab Note on Friday when there is something worth sharing. One-click unsubscribe. No sponsored placements. Privacy.
Patrick Hughes
I build BMD and publish measured AI runs, failure reports, and reusable checks. Nashville, Tennessee.
More writing
- 6 min
How I Budget VRAM for Shared Local AI Workloads
My RTX 5090 measurements show how I budget VRAM for a local model, a real workload, and the GPU processes that must stay resident beside it.
- 5 min
Long Context Cost Me VRAM, Not Tokens a Second
A 94x bigger prompt cost llama3.1:8b only 9.7% of its generation rate. VRAM rose 656 MiB, but num_ctx doubled in the same step. Budget memory first.
- 5 min
One model logged 14.5 and 6,178 prompt tokens a second
gemma4:26b read 53 prompt tokens at 14.5 tok/s and 4,470 at 6,178.9 on the same RTX 5090 run set. Prompt speed is not one number.
- 5 min
The 26B Model Hit the Cap. The 8B Finished.
Same code task, same 512-token cap. Ollama's done_reason showed one local model finished and one got cut off. Tokens per second hid it.
- 5 min
How I Benchmark Local LLMs Before I Trust Them
A local LLM benchmark should end with a decision. I record task quality, tokens per second, VRAM, power, and failure state before I add a model.