Long Context Cost Me VRAM, Not Tokens a Second
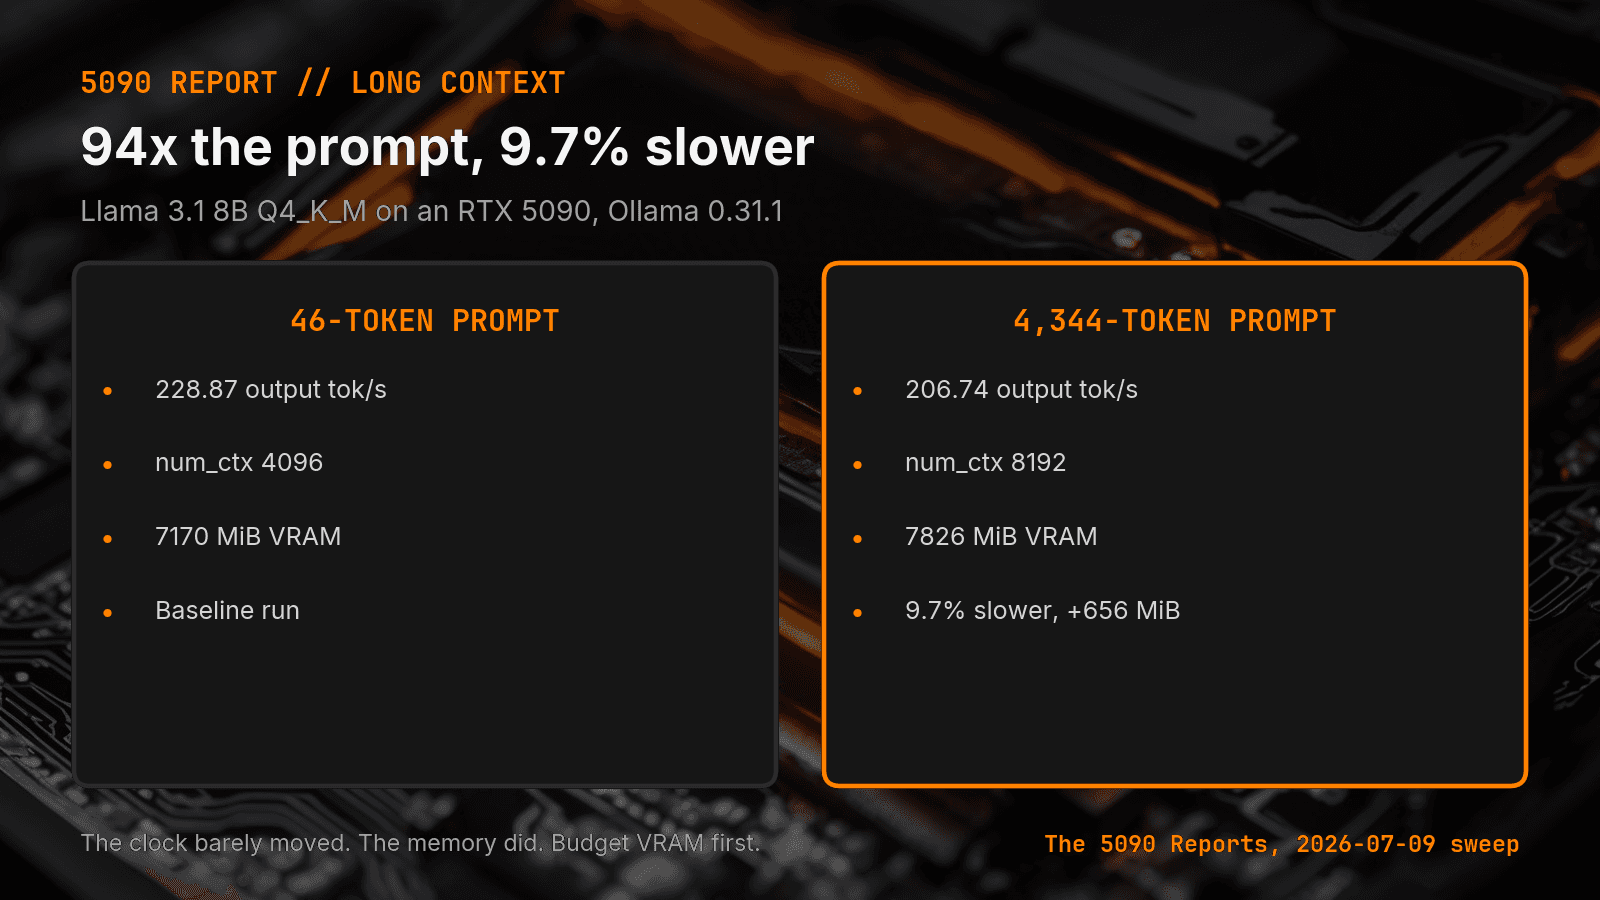
A 94x bigger prompt cost llama3.1:8b only 9.7% of its generation rate. VRAM rose 656 MiB, but num_ctx doubled in the same step. Budget memory first.
I expected a long prompt to slow generation down. I sent a local model 94 times more input and watched the generation rate barely move. The memory moved instead.
Short answer: On an RTX 5090, growing the input from about 50 tokens to about 4,400 cost llama3.1:8b 9.7% of its generation rate. gemma4:26b lost 9.4%. VRAM rose 656 MiB and 301 MiB, but num_ctx doubled from 4096 to 8192 in the same step, so that memory delta is not the prompt alone. Size a long-context local agent by memory headroom first. Canonical URL: https://bmdpat.com/blog/local-llm-long-context-vram-not-throughput-2026
What did the runs measure?
Four rows from Reports/5090/benchmarks/2026-07-09-5090-sweep-llama8b-gemma26b.csv. Both models ran Q4_K_M on Ollama 0.31.1 at temperature 0, on the same RTX 5090.
| Model | Workload | Input tok | num_ctx | Gen tok/s | VRAM after MiB |
|---|---|---|---|---|---|
| llama3.1:8b | short-gen-256 | 46 | 4096 | 228.87 | 7170 |
| llama3.1:8b | long-context-summarize | 4344 | 8192 | 206.74 | 7826 |
| gemma4:26b | short-gen-256 | 53 | 4096 | 198.81 | 19932 |
| gemma4:26b | long-context-summarize | 4470 | 8192 | 180.18 | 20233 |
The tokens_per_second column is the eval token count divided by eval_duration_s. It measures generation only. It does not include the model load or the prompt read. The short rows used num_predict 256. The long rows used 128. I still compare rates, not wall clock, because the rate is eval tokens over eval time.
How much did generation actually slow down?
llama3.1:8b took 94 times the input and dropped from 228.87 to 206.74 tok/s. That is 9.7%.
gemma4:26b took 84 times the input and dropped from 198.81 to 180.18 tok/s. That is 9.4%.
Two different models, two different sizes, almost the same penalty. Neither run collapsed. If I had guessed first, I would have guessed much worse.
What did the memory do?
llama3.1:8b went from 7170 to 7826 MiB, up 656 MiB. gemma4:26b went from 19932 to 20233 MiB, up 301 MiB.
One caveat, and it matters. num_ctx doubled from 4096 to 8192 in the same step that the prompt grew. Two variables moved together. So that memory delta is the combined cost of the wider window and the longer prompt, not the prompt alone. I did not isolate them, and I will not pretend I did.
The direction still holds. The cost showed up in memory, and the clock stayed close to flat.
Why does this change how I size a local model?
Because the binding constraint is the one that fails hard. A 10% throughput loss is an annoyance. Running out of VRAM is a crash or a spill to system memory.
gemma4:26b sat at 20233 MiB of a 32607 MiB card during a 4,470 token summarize. That is 62% of the card for one job at 8192 context. Push the window out for a real agent transcript and the memory line breaks first, not the speed line. I wrote up how I reserve that room in How I Budget VRAM for Shared Local AI Workloads.
What about the time to read the prompt?
llama3.1:8b read 4,344 input tokens in 0.359 seconds. gemma4:26b read 4,470 in 0.723 seconds. Both under a second.
Prompt reading is not free, but at this size it is not the story either. It is also not a stable per-token rate. The same gemma4:26b logged 14.5 prompt tokens a second on a 53 token prompt and 6,178.9 on the 4,470 token one, which I pulled apart in One model logged 14.5 and 6,178 prompt tokens a second.
Would wall clock have told me this?
No, and that is the trap. Both gemma4:26b rows show a total_duration_s near 143 seconds. The short prompt row and the long prompt row look the same on wall clock.
The reason is load_duration_s of 138.5 and 142.1 seconds. The model load dominated both rows. Read those two rows on total time and you would call prompt length free, for the wrong reason. That failure mode has its own post: Your Local LLM Benchmark Is Measuring the Model Load.
What do I record in every row now?
Three fields, or the comparison is unreadable a month later:
input_tokens, so I know what size prompt produced the number.num_ctx, so I can tell a window change from a prompt change. These four rows would be much stronger if it had stayed fixed.vram_after_mib, because on this workload it is the number that moves.
Next sweep I hold num_ctx at 8192 for both prompt sizes. Then the memory delta belongs to the prompt alone, and I can say something these four rows cannot support.
Accompanying prompt
What the prompt does: It runs one local model at two prompt sizes with the context window held fixed, so the VRAM change belongs to the prompt and not to the window.
Copy/paste this prompt:
Copy-ready prompt
Paste the exact block into your coding agent.
No article chrome, no footnotes, no formatting drift.
This prompt and every other one we publish live in the free prompt library.
Copy the block above.
I publish the raw benchmark rows behind these posts, including the runs that make me look wrong. Get them here: https://bmdpat.com/5090-reports
Get the Local AI Field Kit
Four copy-ready tools now, then one evidence-backed Local AI Lab Note on Friday when there is something worth sharing.
Try the free agent run check firstGet the requested artifact now, then at most one evidence-backed Local AI Lab Note on Friday when there is something worth sharing. One-click unsubscribe. No sponsored placements. Privacy.
Written by
Patrick Hughes
I build BMD and publish measured AI runs, failure reports, and reusable checks. Nashville, Tennessee.
More writing
- 5 min
3 Tests Before a GGUF Quant Runs Your Coding Agent
A GGUF file fitting in VRAM does not prove it can run your coding agent. Use this local acceptance test for tools, patches, and repeat runs.
- 5 min
One model logged 14.5 and 6,178 prompt tokens a second
gemma4:26b read 53 prompt tokens at 14.5 tok/s and 4,470 at 6,178.9 on the same RTX 5090 run set. Prompt speed is not one number.
- 5 min
The 26B Model Hit the Cap. The 8B Finished.
Same code task, same 512-token cap. Ollama's done_reason showed one local model finished and one got cut off. Tokens per second hid it.
- 5 min
How I Benchmark Local LLMs Before I Trust Them
A local LLM benchmark should end with a decision. I record task quality, tokens per second, VRAM, power, and failure state before I add a model.
- 5 min
Log Local LLM Fallbacks Before You Score the Output
My local writer hit a host RAM guard, then Sonnet produced a draft that failed QA. Here is how I separate availability, model identity, and useful output.