Ollama Load Time Can Hide a Fast Local LLM
My RTX 5090 run spent 43.48 seconds on model load and 0.17 seconds on output. Split wall time before you judge local LLM speed.
TL;DR
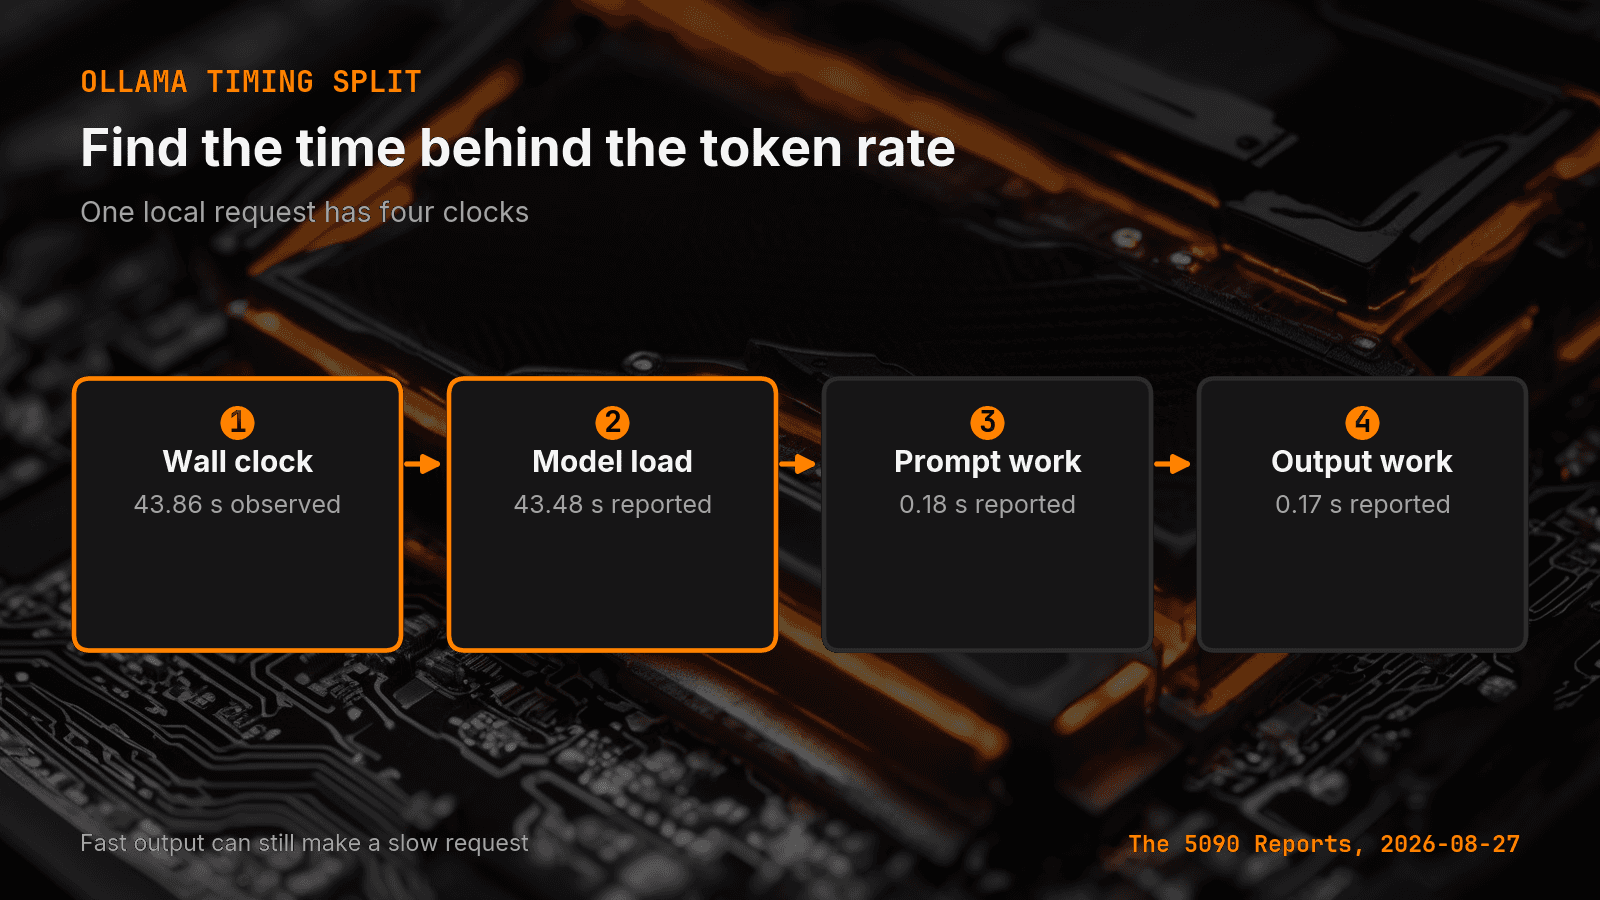
- On August 4, 2026, llama3.1:8b through Ollama recorded 43,860 ms of wall time: 43,476.3 ms of model load, 183.2 ms of prompt work, and 170.06 ms of output work at 188.16 tokens per second.
- The next request used the same model, token counts, and context limit. Its wall time fell to 530 ms. Ollama reported 142.43 ms of load and 208.98 ms of output work.
- Ollama returns total_duration, load_duration, prompt_eval_duration, and eval_duration. Do not use tokens per second as the only local LLM speed result.
My local LLM produced tokens at 188.16 tokens per second. The request still took 43.86 seconds. The model was fast, but the load was not.
The short answer: Do not use tokens per second as the only local LLM speed result. Split wall time into model load, prompt work, and output work. A slow load can hide fast output, while a resident model can make the same task feel much faster.
Canonical URL: https://bmdpat.com/blog/ollama-load-duration-local-llm-benchmark-2026
What did the RTX 5090 run record?
On August 4, 2026, I sent a small decision task to llama3.1:8b through Ollama. The request used a 1,024-token context limit. It read 44 prompt tokens and wrote 32 output tokens.
The first row in my August 27 report recorded 43,860 ms of wall time. Ollama reported 43,476.3 ms of model load, 183.2 ms of prompt work, and 170.06 ms of output work. The output rate was 188.16 tokens per second.
That output rate sounds fast because it is fast. It only describes the output phase. It does not include the long load that the user had to wait through.
The next request used the same model, token counts, and context limit. Its wall time fell to 530 ms. Ollama reported 142.43 ms of load and 208.98 ms of output work.
The report did not record the model residency state. I will not label the second row as a proven warm run. I can state the narrower result: the second request had far less load time, and its full wait was about half a second.
Which Ollama timing fields matter?
Ollama returns separate timing fields from its generate endpoint. Its API reference defines total_duration, load_duration, prompt_eval_duration, and eval_duration in nanoseconds.
I convert those values to milliseconds before I compare runs. Each field answers a different question.
total_duration shows Ollama's full request time. load_duration shows time spent on model load. prompt_eval_duration shows time spent on the input. eval_duration shows time spent on output tokens.
I also keep an outside wall clock. It includes client work and local transport around the Ollama call. If the wall clock and total_duration differ by a large amount, I check the client path before I blame the model.
This split extends the wall-clock test I use beside tokens per second. One rate cannot explain every part of a request.
Why can tokens per second give the wrong verdict?
Tokens per second answers a narrow question: how fast did the model write after output work started? A person waiting for a coding agent cares about the full delay before the useful result arrives.
A cold load can dominate a short task. A long prompt can move the delay into prompt work. A large output can make output work dominant. The same model can therefore need different changes for three slow requests.
If load time is high, I check model reuse, process churn, and memory pressure. If prompt time is high, I check context size and repeated input. If output time is high, I compare model size, quant, runtime settings, and hardware fit.
I do not tune all three at once. That would erase the cause. I change one boundary, run the same task again, and save another row.
How should a local LLM benchmark store timing?
Store the raw duration fields with the model, runtime version, prompt count, output count, context limit, and wall time. Keep the source unit or save the conversion rule beside the schema.
Do not replace total time with output rate. Keep both. A benchmark row should let another builder answer two separate questions: how fast was token output, and how long did the request make the user wait?
I also record missing state as missing. My August 4 rows say residency_state=unrecorded. That is better than changing an unknown into a warm-load claim.
This follows the same rule as my local LLM benchmark decision record. A measurement earns a decision only when the row keeps enough context to explain it later.
What should you change first?
Start with the largest measured part of the request. In my 43.86-second row, model load was the clear first target. Output speed was not the problem to solve.
Then repeat the exact workload. Keep the prompt, token cap, context limit, and model fixed. Compare the full timing split, not one attractive rate.
That small rule prevents wasted tuning. It also stops a fast token rate from hiding a slow user path.
Accompanying prompt
What the prompt does: Reviews one Ollama benchmark row and finds which measured phase should get the first change.
Copy/paste this prompt:
Copy-ready prompt
Paste the exact block into your coding agent.
No article chrome, no footnotes, no formatting drift.
This prompt and every other one we publish live in the free prompt library.
Copy the block above.
I publish measured local AI tests in The 5090 Reports. Join the email list for the next result.
FAQ
What did the RTX 5090 run record?
A small llama3.1:8b decision task with a 1,024-token context limit read 44 prompt tokens and wrote 32 output tokens. The first row recorded 43,860 ms of wall time, of which 43,476.3 ms was model load. Output rate was 188.16 tokens per second.
Which Ollama timing fields matter?
total_duration is the full request time, load_duration is model load, prompt_eval_duration is input work, and eval_duration is output-token work. Convert nanoseconds to milliseconds before you compare runs, and keep an outside wall clock for client and transport time.
Why can tokens per second give the wrong verdict?
Tokens per second only describes how fast the model wrote after output work started. A cold load can dominate a short task, so a fast output rate can still leave the user waiting tens of seconds.
Get the Local AI Field Kit
Four copy-ready tools now, then one evidence-backed Local AI Lab Note on Friday when there is something worth sharing.
Try the free agent run check firstGet the requested artifact now, then at most one evidence-backed Local AI Lab Note on Friday when there is something worth sharing. One-click unsubscribe. No sponsored placements. Privacy.
Patrick Hughes
I build BMD and publish measured AI runs, failure reports, and reusable checks. Nashville, Tennessee.
More writing
- 5 min
A 32 GB GPU Still Needs Host RAM Headroom
My RTX 5090 had 32 GB of VRAM ready, but my local policy stopped Ollama at 7.02 GiB of free host RAM. Here is my preflight before model load.
- 5 min
Log Local LLM Fallbacks Before You Score the Output
My local writer hit a host RAM guard, then Sonnet produced a draft that failed QA. Here is how I separate availability, model identity, and useful output.
- 5 min
My local daily brief used 0 model calls
On September 4, 2026 my llama3.1:8b daily brief was ready with 0 model calls and 0 seconds. Preview-only file ranking is not a model run.
- 5 min
Long Context Cost Me VRAM, Not Tokens a Second
A 94x bigger prompt cost llama3.1:8b only 9.7% of its generation rate. VRAM rose 656 MiB, but num_ctx doubled in the same step. Budget memory first.
- 5 min
One model logged 14.5 and 6,178 prompt tokens a second
gemma4:26b read 53 prompt tokens at 14.5 tok/s and 4,470 at 6,178.9 on the same RTX 5090 run set. Prompt speed is not one number.