One model logged 14.5 and 6,178 prompt tokens a second
gemma4:26b read 53 prompt tokens at 14.5 tok/s and 4,470 at 6,178.9 on the same RTX 5090 run set. Prompt speed is not one number.
Two rows in my 2026-08-27 report describe the same model on the same GPU. One says it read prompt tokens at 14.5 a second. The other says 6,178.9. Nothing about the model changed between them. The prompt size did.
Short answer: A local model has no single prompt ingestion rate. These runs used different input sizes, so their prompt rates do not support a direct speed ranking. Size the model with a prompt the size it will really get. Canonical URL: https://bmdpat.com/blog/local-llm-prompt-eval-rate-prompt-size-2026
What did the two runs record?
Both rows are gemma4:26b, quant Q4_K_M, on Ollama 0.31.1, temperature 0, on the RTX 5090.
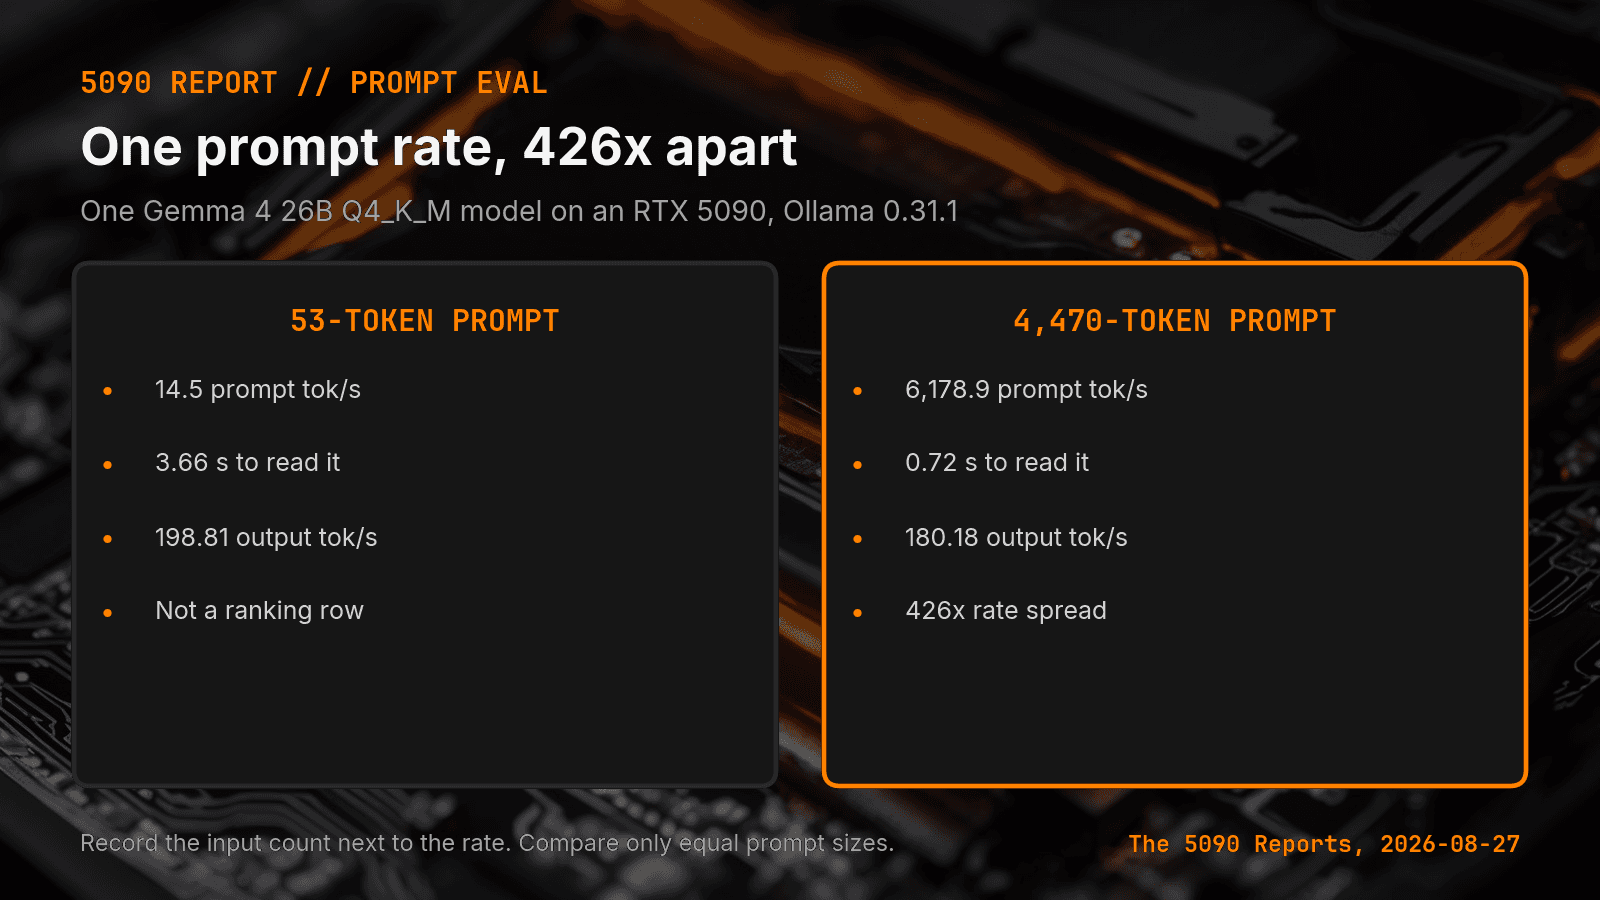
The short-gen-256 run sent 53 input tokens with num_ctx=4096. Ollama reported prompt_eval of 53 tokens at 14.5 tok/s. That is about 3.66 seconds to read 53 tokens.
The long-context-summarize run sent 4,470 input tokens with num_ctx=8192. Ollama reported prompt_eval of 4,470 tokens at 6,178.9 tok/s. That is about 0.72 seconds to read 4,470 tokens.
The bigger prompt was 84 times larger and finished reading in a fifth of the time. As a rate, that is a 426x spread on one model in one report.
These are the same Gemma 4 26B rows I already published when I split input and output timing. That post showed why one blended speed is a bad score. This post is the next failure: ranking prompt rates after you split them.
Why can I not rank these prompt rates?
A rate is work divided by time. These rows divide different token counts by different prompt_eval intervals.
The rows do not isolate any fixed cost. They only record the prompt token count and the full prompt_eval interval. Ollama documents both fields in its generate API.
I do not have a field that says why the 53-token interval took 3.66 seconds. The honest read is narrower. The 14.5 tok/s row does not define gemma4:26b's prompt speed for a 4,470-token job.
Did the same thing happen on the 8B model?
The same report has another unmatched pair. llama3.1:8b Q4_K_M on the same engine read 46 tokens at 679.4 tok/s and 4,344 tokens at 12,108.7 tok/s.
That is a 17.8x spread, not 426x. Both pairs mix a short input with a long input. Neither pair supports a prompt-speed ranking.
Two models, four rows, and not one of them supports a sentence that starts with "this model reads prompts at."
Why does the output rate stay stable?
Compare the generation column for the same two gemma4:26b runs. Short prompt: 198.81 output tok/s. Long prompt: 180.18 output tok/s. That is about a 10 percent gap.
These two output rates stayed much closer than the prompt rates. That result does not explain the input spread. It shows why I compare each phase with matched work.
Splitting the phases is not enough if you then compare input rates across different prompt sizes. It is the same failure I hit with wall clock, where the faster run took 83x longer. A rate with a small denominator will lie to you in a table that looks orderly.
What does this change about sizing a local agent?
A retrieval worker or a coding worker sends a lot of input. A file, an error log, tool output, and instructions add up fast. If I size that job from a 53-token test prompt, I predict the wrong thing in both directions.
So I test at the prompt size the job will really send. If the agent will carry 4,000 tokens of context, the sizing run carries 4,000 tokens. A short smoke test proves the model answers. It does not measure ingestion.
I also stopped ranking models by prompt rate across rows that used different input sizes. That comparison has no meaning. If the input counts differ, the rates are not comparable, and no amount of averaging repairs it.
What do I record now?
Every prompt rate in my table carries its input token count and its num_ctx in the same row. A rate without its denominator is not a measurement I can reuse later.
I mark any prompt-eval rate under 1,000 tokens of input as indicative, not comparable. It still goes in the table, because failed and weak rows are worth keeping. It just cannot be quoted against a production-sized run.
The rule is short. Record the count next to the rate, and only compare rates that read prompts of the same size.
Accompanying prompt
What the prompt does: It checks whether two local model prompt-eval rates can be compared, and rejects the comparison when the input sizes differ.
Copy/paste this prompt:
Copy-ready prompt
Paste the exact block into your coding agent.
No article chrome, no footnotes, no formatting drift.
This prompt and every other one we publish live in the free prompt library.
Copy the block above.
Get the next measured local-AI field note by email: The 5090 Reports.
Get the Local AI Field Kit
Four copy-ready tools now, then one evidence-backed Local AI Lab Note on Friday when there is something worth sharing.
Try the free agent run check firstGet the requested artifact now, then at most one evidence-backed Local AI Lab Note on Friday when there is something worth sharing. One-click unsubscribe. No sponsored placements. Privacy.
Patrick Hughes
I build BMD and publish measured AI runs, failure reports, and reusable checks. Nashville, Tennessee.
More writing
- 5 min
Split Local LLM Prose and JSON Jobs by Model
My local AI stack routes prose to Gemma and bounded JSON to Qwen. The split keeps model choice tied to the output contract, not one leaderboard.
- 5 min
Long Context Cost Me VRAM, Not Tokens a Second
A 94x bigger prompt cost llama3.1:8b only 9.7% of its generation rate. VRAM rose 656 MiB, but num_ctx doubled in the same step. Budget memory first.
- 5 min
The 26B Model Hit the Cap. The 8B Finished.
Same code task, same 512-token cap. Ollama's done_reason showed one local model finished and one got cut off. Tokens per second hid it.
- 5 min
How I Benchmark Local LLMs Before I Trust Them
A local LLM benchmark should end with a decision. I record task quality, tokens per second, VRAM, power, and failure state before I add a model.
- 5 min
Log Local LLM Fallbacks Before You Score the Output
My local writer hit a host RAM guard, then Sonnet produced a draft that failed QA. Here is how I separate availability, model identity, and useful output.