I Raised the QA Bar on Blog Infographics
Blog charts need correct labels. I tightened layout geometry, char budgets, claims checks, and vision logs so a bad PNG cannot ship quietly.
TL;DR
- A chart could pass it rendered and still look sloppy: numbers in corners, tiny labels, digits that never appear in the post.
- A four-step row stays tight at 18/22. Five or more steps use a two-row grid so cards do not crush. Digits in the graphic require --claims or publish exits 8.
- Footer text stays at the same readable floor as body labels (7pt minimum). The unit suite under config/visuals/ is at 29 tests as of 2026-07-13.
- I will not put labels inside a diffusion model. Fail closed means ship text-only or fix the spec.
I ship measured local-model posts with charts. Generative image tools garble numbers. So the fleet uses one matplotlib renderer under config/visuals/. Exact text. Fixed brand colors.
That still was not enough. A chart could pass "it rendered" and still look sloppy: numbers in corners, tiny labels, digits that never appear in the post. I raised the bar.
What failed before
The first defect class was layout. Step numbers sat in the top-left of a card while the label sat in the center. Peer cards did not share baselines. Long labels shrank below a readable floor.
The second class was honesty. A graphic could invent a comparison that no metrics file contained. Vision QA only checked whether the image looked clean, not whether the numbers were true.
The third class was publish mechanics. Committing a PNG from a feature branch worktree was easy to get wrong. Agents need a path that always targets main for the one asset file.
The gates
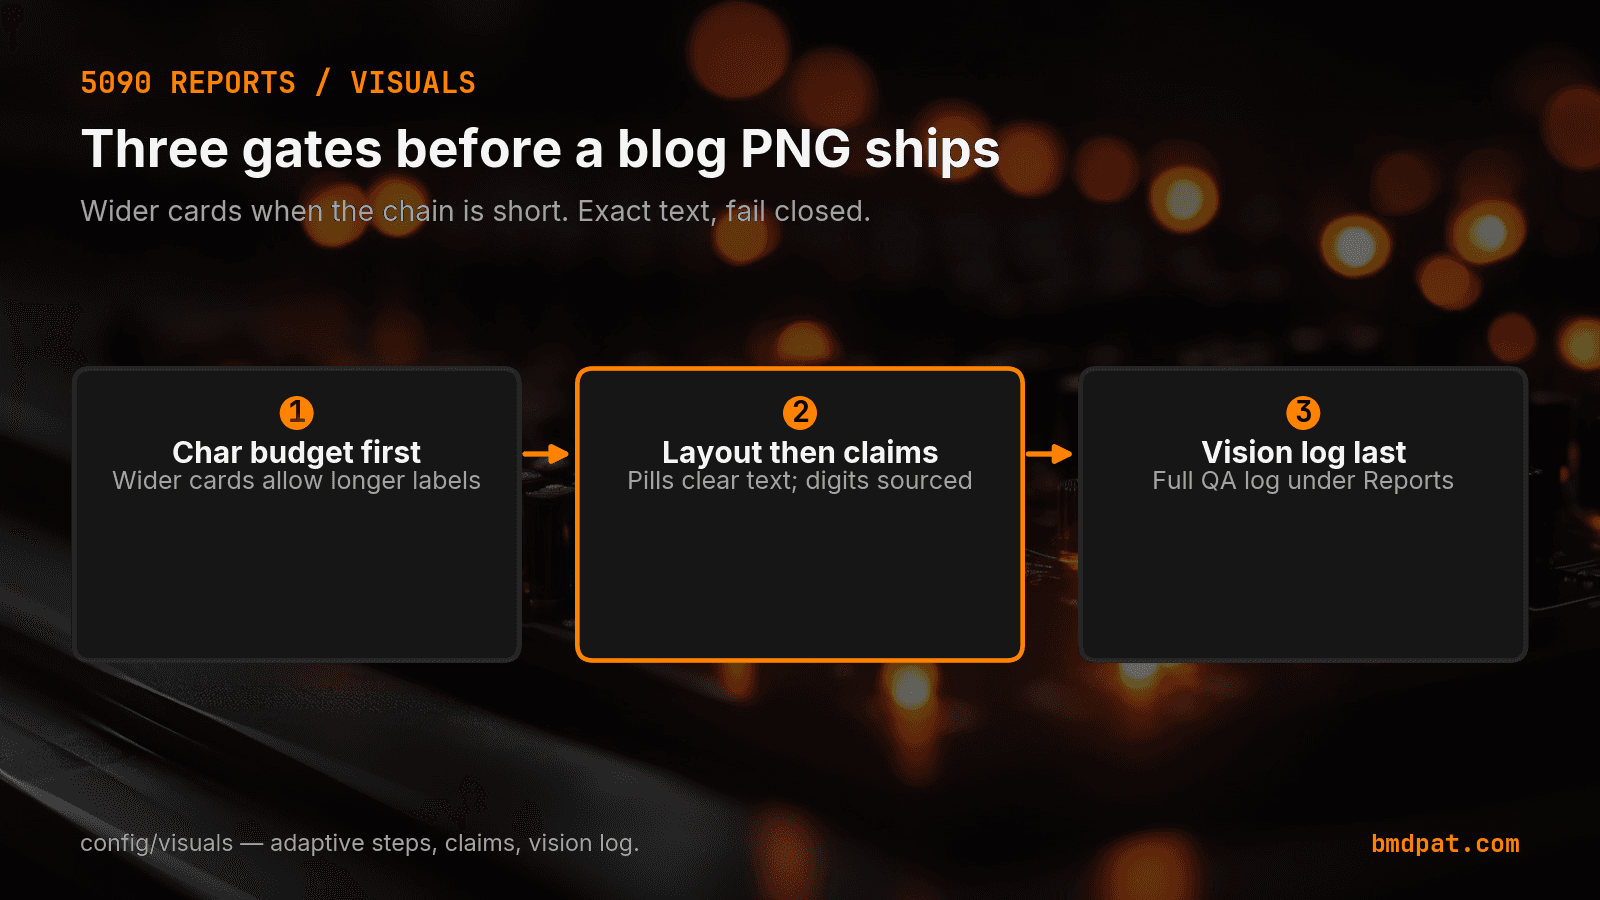
Every blog infographic now hits the same chain before an embed line is printed.
- Char budget. Budgets scale with step count. A short chain (n≤3) gets wider cards and longer labels. A four-step row stays tight (18/22). Five or more steps use a two-row grid so cards do not crush.
- Layout then claims. Numbers, labels, and subs share peer baselines. Step indexes sit in orange pills with clearance so they never paint over the words. Digits in the graphic require
--claims <post or metrics>or publish exits 8. - Vision log. The vision gate still fail-closes. Full stdout and stderr land under
Reports/Visuals/so a timeout is not a mystery.
Footer text stays at the same readable floor as body labels (7pt minimum). Titles sit on a dark header scrim so ambient textures cannot wash them out.
What I measure
The unit suite under config/visuals/ is at 29 tests as of 2026-07-13. Selftest renders every file in examples/ and specs/ (13 specs after this post). Geometry QA checks containment, min size, peer baselines, and peer line counts. Char lint runs before draw.
I also re-rendered the live vector-migration post asset earlier the same day after the first stack fix. New posts get the full gate set automatically when they use publish_blog_asset.py.
What I will not do
I will not put labels inside a diffusion model. Charts need crisp, correct English. Ambient textures stay under the diagram. Text stays on the matplotlib layer.
I will not ship a PNG that fails any gate. Fail closed means ship text-only or fix the spec. That is intentional.
When a graphic is worth it
Use a chart when the post has a process, a comparison, or a set of numbers. Write the short labels first. Point --claims at the draft. If the story needs long phrases, use fewer steps or a stats/flow template. Do not fight the 4-up width with paragraphs inside cards.
The contract lives in Prompts/Includes/blog-publish.md and config/visuals/README.md. Agents read it before inventing a one-off plot.
Accompanying prompt
What the prompt does: This prompt turns a draft post into a fail-closed infographic publish checklist with char budgets and claims.
Copy/paste this prompt:
Copy-ready prompt
Paste the exact block into your coding agent.
No article chrome, no footnotes, no formatting drift.
This prompt and every other one we publish live in the free prompt library.
Copy the block above.
I publish measured local-model work and the systems around it in The 5090 Reports. Join the list for the next artifact.
For related layout and local-model posts, see I rebuilt 5,383 embeddings after a dimension change and the num_ctx reload tax.
FAQ
What failed before the infographic QA raise?
Layout: step numbers sat in the top-left of a card while the label sat in the center. Honesty: a graphic could invent a comparison that no metrics file contained. Publish: committing a PNG from a feature branch worktree was easy to get wrong.
What gates does every blog infographic hit?
Char budget scaled to step count, layout then claims with --claims required for digits, and a vision log under Reports/Visuals/ that still fail-closes.
When is a graphic worth it?
Use a chart when the post has a process, a comparison, or a set of numbers. Write the short labels first. If the story needs long phrases, use fewer steps or a stats/flow template.
Get the Local AI Field Kit
Four copy-ready tools now, then one evidence-backed Local AI Lab Note on Friday when there is something worth sharing.
Try the free agent run check firstGet the requested artifact now, then at most one evidence-backed Local AI Lab Note on Friday when there is something worth sharing. One-click unsubscribe. No sponsored placements. Privacy.
Patrick Hughes
I build BMD and publish measured AI runs, failure reports, and reusable checks. Nashville, Tennessee.
More writing
- 6 min
I Rebuilt 5,383 Embeddings After a Dimension Change
I moved a vault search index from 1,536 to 768 dimensions. Here is why I rebuilt all 5,383 chunks instead of mixing vector spaces.
- 5 min
RFC 9110 402 Payment Required: Reserved for Future Use
RFC 9110 reserves status 402 for future use with zero wire protocol details. Check the IANA registry entry and handle custom payment headers in your client.
- 5 min
llama.cpp max context length gpu memory: What Fits
Find out how context length drives GPU memory in llama.cpp, how the KV cache scales, and which flags keep your local inference runs within VRAM limits.
- 5 min
How to Route Local LLM Workloads with Open Weights
Open weights match coding parity while cloud models lead on reasoning. Route your 5090 workloads using verified 2026 inference pricing and benchmark data.
- 5 min
Bonsai 27B vs Gemma 4 E4B: Which Should You Run?
Compare Ternary Bonsai 27B and Gemma 4 E4B for local AI. See VRAM footprints, multimodal support, benchmark scores, and run commands for your setup.