LLM GPU Costs Unexpectedly High: How to Diagnose the Bill
When LLM GPU costs are unexpectedly high, idle replica minutes, cold starts, and separate disk fees inflate invoices. Here is how to audit your runtime spend.
LLM GPU costs run unexpectedly high when cloud platforms bill for idle uptime, model loading, and detached disk storage rather than completed token output.
Hosted providers bill for replica minutes whether requests arrive or not. When you deploy an endpoint, you rent hardware time. To find the source of the waste, you must compare billed compute time against completed work.
Why are your cloud LLM GPU costs unexpectedly high?
Your cloud LLM GPU costs run unexpectedly high because hosted endpoints bill by active clock time rather than token counts. Active billing covers initialization time, waiting states, and lingering replicas after bursts finish. Separate persistent storage charges also accrue while compute is off.
Hosted infrastructure bills for presence. According to the Hugging Face Inference Endpoints pricing documentation, Hugging Face charges for initialization and running states by the minute. If you send ten queries over an hour, you pay for sixty minutes of hardware access.
Autoscaling adds another expense. When traffic rises, autoscaling provisions extra instances. The Hugging Face Inference Endpoints pricing guide notes that billable hours combine your baseline replicas and spike replicas across their full run durations. If scaling rules lag after traffic subsides, empty replicas keep accumulating charges.
Idle settings also trigger operational trade-offs. The Hugging Face autoscaling guide explains that endpoints default to scaling to zero after one hour of inactivity. While scaled to zero, new traffic receives an HTTP 503 response during initialization unless a waiting mechanism catches it. If you keep a replica active to prevent that startup latency, you pay for round-the-clock uptime.
Storage causes surprise costs as well. As documented in the Runpod storage guide, stopping a Runpod Pod halts GPU charges, but Volume Disk storage charges continue. Compute charges stop. Storage charges stay on your invoice.
For broader cloud hardware allocation trade-offs, see the cloud scarcity context.
How does useful work differ from billed GPU time?
Useful work measures completed tokens delivered under a defined latency ceiling, while billed GPU time counts total elapsed seconds. A cluster can show high utilization during cold starts or queue pileups without delivering useful output. Sizing requires comparing throughput against end-to-end user latency targets.
You cannot evaluate cost from peak token throughput alone. In an independent analysis, the NVIDIA inference benchmarking methodology demonstrates that teams must first measure throughput under a strict latency constraint. From that constraint, you calculate the required deployment size and add hardware depreciation, hosting expenses, and software overhead.
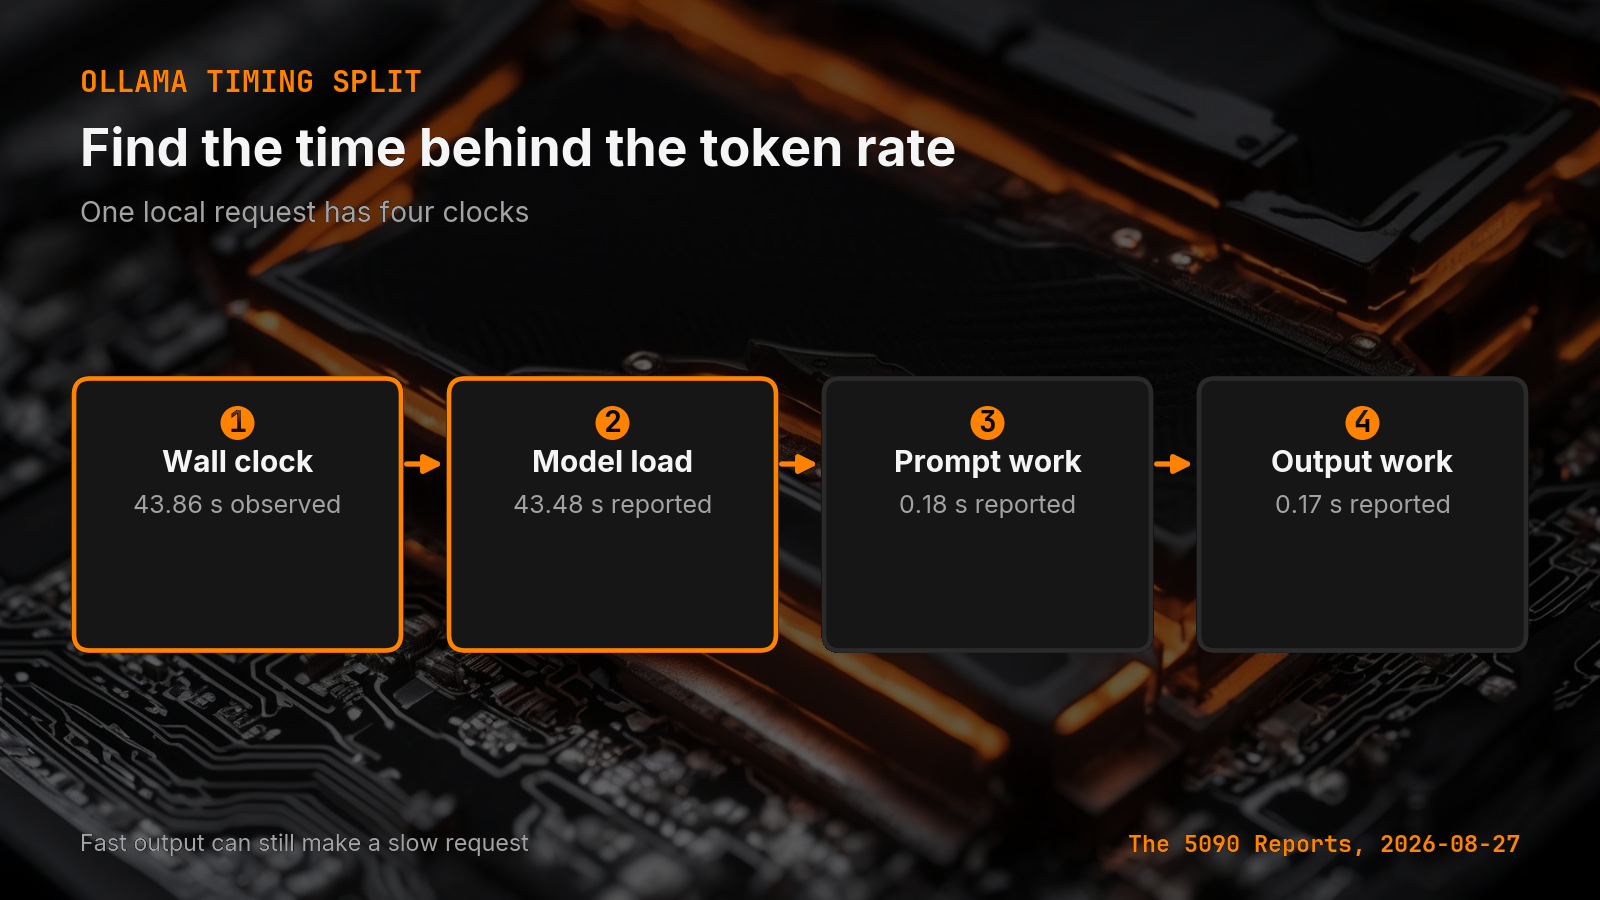
Model initialization adds substantial latency that inflates run durations. In our local benchmark file Reports/5090/benchmarks/2026-08-04-ollama.csv, two single-shot runs for llama3.1:8b processed 44 input tokens and 32 output tokens. The first run recorded a total duration of 43832.66 milliseconds, with 43476.3 milliseconds spent in load duration. The second run recorded a total duration of 504.78 milliseconds, with 142.43 milliseconds in load duration.
The residency in those recorded rows was unrecorded, so they do not represent a controlled experiment. Even so, they show how cold initialization dominates wall-clock runtimes. If your hosted setup charges for initialization minutes, load delays directly inflate your bill.
 Open full-size image (opens in new tab)
The chart names those four timing fields. It is not a plot of the two rows above.
When planning hardware capacity and model footprints, consult our VRAM calculator, check our GGUF quantization explained breakdown, and review our 5090 local inference guide.
How do concurrency and context bloat GPU memory?
Concurrency and context length inflate GPU requirements by scaling memory demands across simultaneous slots. When requests exceed available video memory, runtimes fall back to CPU memory or throttle execution. That slowdown increases elapsed seconds per request and drives up duration-based billing.
Local runtimes document this relationship clearly. According to the Ollama FAQ, memory needs scale with OLLAMA_NUM_PARALLEL multiplied by OLLAMA_CONTEXT_LENGTH. Raising concurrent worker slots or token context windows multiplies allocation targets.
To check model placement on local or dedicated hardware, run this command:
ollama ps
The output displays a PROCESSOR column. It confirms whether the runtime placed the model fully on the GPU, fully on the CPU, or split between both. Split placement slows processing. Slower processing increases elapsed execution time.
What should you do with this?
- Audit billed replica minutes against request volume by pulling instance run logs and checking how long autoscaled nodes linger after traffic drops.
- Check your storage ledger to confirm whether stopped instances continue to bill for attached volume disks.
- Benchmark actual throughput under your target latency limits using
ollama psto verify memory offloading before selecting instance sizes.
Accompanying prompt
What the prompt does: Audits cloud LLM endpoints for idle replica waste, storage drift, and memory allocation bottlenecks.
Copy/paste this prompt:
Copy-ready prompt
Paste the exact block into your coding agent.
No article chrome, no footnotes, no formatting drift.
This prompt and every other one we publish live in the free prompt library.
Copy the block above.
Weekly measured local runs: https://bmdpat.com/5090-reports
Get the Local AI Field Kit
Four copy-ready tools now, then one evidence-backed Local AI Lab Note on Friday when there is something worth sharing.
Try the free agent run check firstGet the requested artifact now, then at most one evidence-backed Local AI Lab Note on Friday when there is something worth sharing. One-click unsubscribe. No sponsored placements. Privacy.
Written by
Patrick Hughes
I build BMD and publish measured AI runs, failure reports, and reusable checks. Nashville, Tennessee.
More writing
- 5 min
Three carried backlog items moved on 2026-11-06
On 2026-11-06, three carried items merged in thirty minutes. Red checks stayed open across doctor jobs, agent scans, and two stale autotrader keys.
- 5 min
Is OpenClaw Worth It? Setup Costs and Risks
OpenClaw offers free self-hosted messaging agents under the MIT license, but model token fees, host security, and skill audits determine your real costs.
- 5 min
OpenClaw AI Assistant Latest News 2026
OpenClaw release v2026.10.4 repairs sleep restarts and Tlon permissions, following skill discovery, MCP Apps, and R2 backup updates in October 2026.
- 5 min
What Does Q4_K_M Mean? GGUF Quantization Decoded
Learn the exact meaning of Q4_K_M in llama.cpp, how its mixed tensor precisions work, and how to verify if it fits your consumer GPU VRAM budget.
- 5 min
Q6_K vs Q8_0: Which GGUF Preset Fits Your Setup?
Compare Q6_K and Q8_0 presets for llama.cpp. See real VRAM allocation, file sizes, and test steps to decide which GGUF quantization fits your card.