How to Calculate Local LLM Energy per Token
My RTX 5090 test shows how watts and output rate become joules per token, and why the faster of two matched settings can waste energy.
TL;DR
- Divide average GPU watts by output tokens per second. The result is joules per output token.
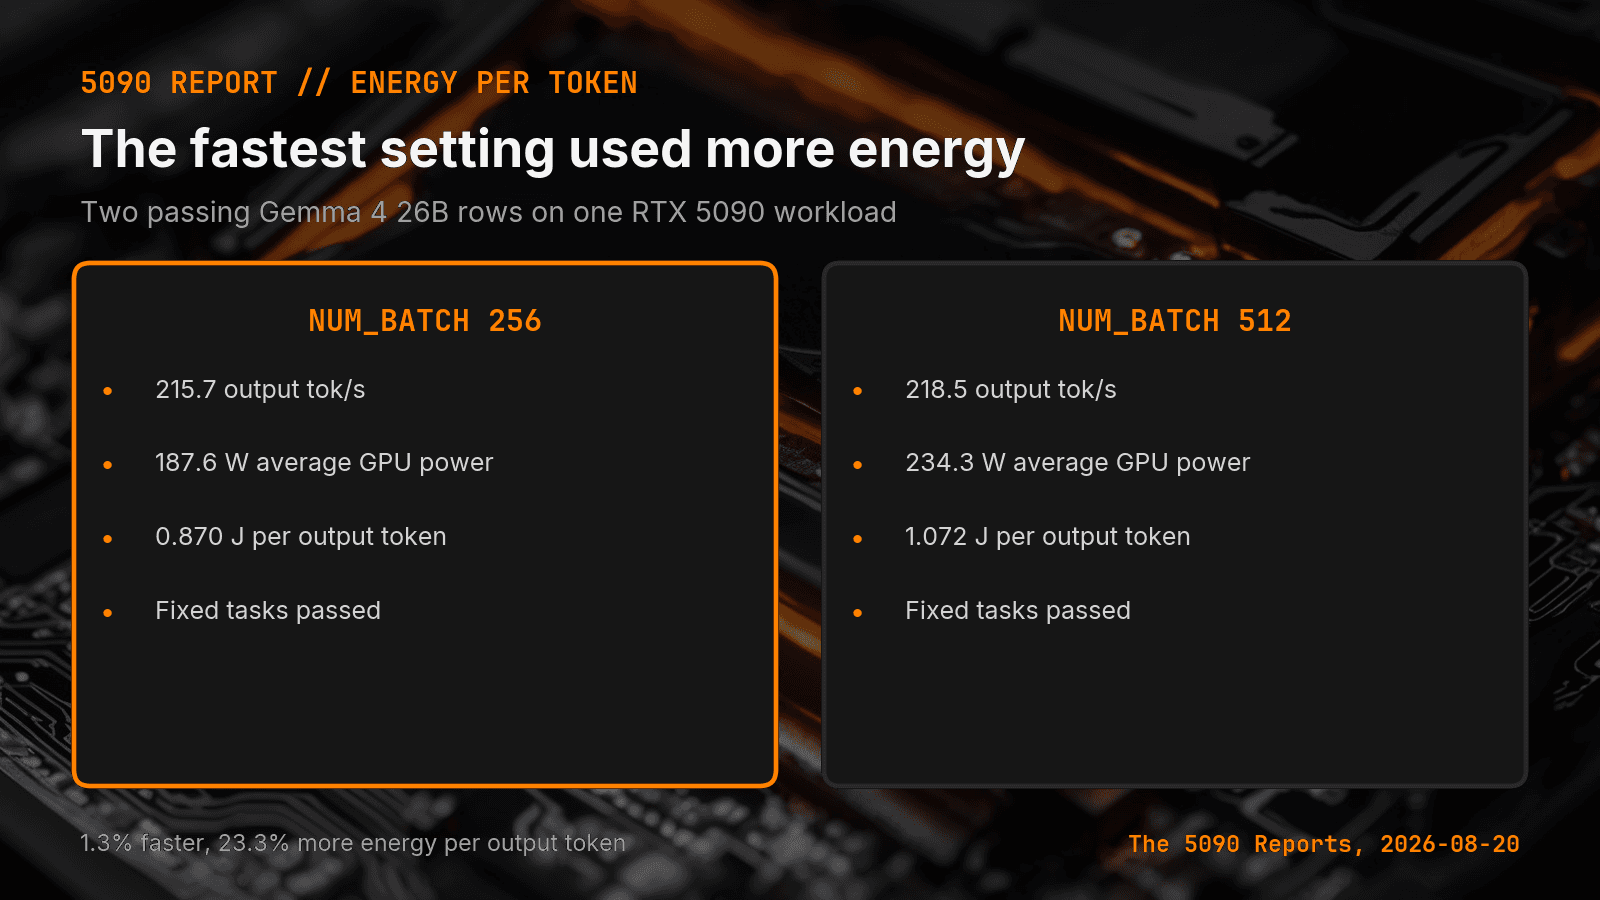
- Two gemma4:26b workshop rows on the August 20, 2026 5090 Report used a 2,048-token context, 91 input tokens, and 482 output tokens. num_batch=256: 215.7 tok/s, 187.6 W, 0.870 J/token. num_batch=512: 218.5 tok/s, 234.3 W, 1.072 J/token.
- The 512 row generated 1.3% faster. Average GPU power rose 24.9%. Energy per output token rose 23.3%.
- One million output tokens at 0.870 joules each is about 0.242 kWh for the generation phase. The 512 row reaches about 0.298 kWh per million output tokens.
The faster of two matched gemma4:26b settings was not the most efficient. One run gained 1.3% output speed and used 23.3% more energy per output token.
The short answer: Divide average GPU watts by output tokens per second. The result is joules per output token. In my RTX 5090 test, num_batch=256 used about 0.870 joules per output token. The 512 setting used about 1.072. Speed alone hid that difference.
Canonical URL: https://bmdpat.com/blog/local-llm-energy-per-token-2026
How do watts become joules per token?
NIST defines a watt as one joule per second. A model rate is output tokens per second. Divide the first rate by the second rate, and seconds cancel.
joules per output token = average GPU watts / output tokens per second
This number answers a narrow question. It estimates GPU energy during the measured generation period. It does not include the rest of the computer, model load time, prompt work, cooling, or idle power.
What did the two RTX 5090 rows show?
The August 20, 2026 5090 Report includes two gemma4:26b workshop rows. Both used Ollama, a 2,048-token context, 91 input tokens, and 482 output tokens. Both passed the fixed tasks.
| Setting | Output rate | Average GPU power | Energy per output token |
|---|---|---|---|
num_batch=256 | 215.7 tok/s | 187.6 W | 0.870 J/token |
num_batch=512 | 218.5 tok/s | 234.3 W | 1.072 J/token |
The arithmetic is direct. 187.6 / 215.7 = 0.8697. 234.3 / 218.5 = 1.0723. I round each result to three decimal places in the table.
The 512 row generated 1.3% faster. Average GPU power rose 24.9%. Energy per output token rose 23.3%.
Why is energy per token better than watts alone?
Watts measure a rate of energy use. They do not say how much work finished during that time. A 200-watt run can use less total energy than a 150-watt run if it finishes much sooner.
Tokens per second have the opposite gap. They say how fast output arrived, but not how much power the GPU drew to produce it. The fastest row can also be the least efficient row.
Joules per token join those two fields. The unit still does not say whether the answer was correct. I only compare rows after the task check passes. My earlier failed-row note shows why a fast row with a failed task stays out of production.
Can I turn this into electricity cost?
Yes, but I label the estimate. One million output tokens at 0.870 joules each equals 870,000 joules. Divide by 3.6 million joules per kilowatt-hour. The generation estimate is about 0.242 kWh.
The 512 row reaches about 0.298 kWh per million output tokens by the same method. That is a difference of about 0.056 kWh for the measured generation phase.
I do not call either number a full local inference cost. A full receipt also needs wall power, prompt work, load time, idle time, hardware cost, and the electricity rate. My local AI workbench note uses the same boundary when it converts one measured run into a rough electricity estimate.
When should I use this metric?
I use it after two rows pass the same task check. I keep the model, quant, runtime, workload, context, prompt, and output cap fixed. I also record the token counts so a later reader can see whether the runs did the same work.
Then I ask three questions. Did the task pass? Did the faster setting remove useful wait time? Did energy per output token improve or get worse?
For this workload, num_batch=256 is the better measured setting. It produced 98.7% of the 512 row's output rate while using less average GPU power and less energy per output token. That is a result for this RTX 5090 test, not a default for every model or GPU.
What should the benchmark receipt keep?
Keep the raw fields before the derived metric. Save the model, quant, runtime version, GPU, workload, context, output cap, input tokens, output tokens, output rate, average GPU power, and task result.
Calculate joules per output token from those saved values. Do not save only the rounded answer. The raw row lets another builder check the math and change the boundary.
Also name what the power sensor measured. GPU power is not wall power. A generation average is not a whole-request average. A clear label stops a small metric from becoming a large claim.
Accompanying prompt
What the prompt does: It calculates energy per output token from local LLM rows and rejects comparisons that lack a task check.
Copy/paste this prompt:
Copy-ready prompt
Paste the exact block into your coding agent.
No article chrome, no footnotes, no formatting drift.
This prompt and every other one we publish live in the free prompt library.
Copy the block above.
Get the next measured local AI build note from The 5090 Reports.
FAQ
How do watts become joules per token?
A watt is one joule per second. Divide average GPU watts by output tokens per second. The number estimates GPU energy during the measured generation period. It does not include the rest of the computer, model load time, prompt work, cooling, or idle power.
What did the two RTX 5090 rows show?
num_batch=256 used 187.6 W at 215.7 tok/s, or 0.870 J per output token. num_batch=512 used 234.3 W at 218.5 tok/s, or 1.072 J per output token. Both passed the fixed tasks on gemma4:26b.
Can I turn this into electricity cost?
Yes, as a labeled estimate. One million output tokens at 0.870 joules each equals 870,000 joules, or about 0.242 kWh. The 512 row is about 0.298 kWh per million output tokens, a difference of about 0.056 kWh for the measured generation phase. GPU power is not wall power.
Get the Local AI Field Kit
Four copy-ready tools now, then one evidence-backed Local AI Lab Note on Friday when there is something worth sharing.
Try the free agent run check firstGet the requested artifact now, then at most one evidence-backed Local AI Lab Note on Friday when there is something worth sharing. One-click unsubscribe. No sponsored placements. Privacy.
Patrick Hughes
I build BMD and publish measured AI runs, failure reports, and reusable checks. Nashville, Tennessee.
More writing
- 4 min
Why a Failed Local LLM Benchmark Row Still Matters
A failed local LLM row marks the test boundary. My RTX 5090 report shows why quality, speed, and settings belong in one receipt.
- 5 min
Log Local LLM Fallbacks Before You Score the Output
My local writer hit a host RAM guard, then Sonnet produced a draft that failed QA. Here is how I separate availability, model identity, and useful output.
- 5 min
My local daily brief used 0 model calls
On September 4, 2026 my llama3.1:8b daily brief was ready with 0 model calls and 0 seconds. Preview-only file ranking is not a model run.
- 5 min
Long Context Cost Me VRAM, Not Tokens a Second
A 94x bigger prompt cost llama3.1:8b only 9.7% of its generation rate. VRAM rose 656 MiB, but num_ctx doubled in the same step. Budget memory first.
- 5 min
One model logged 14.5 and 6,178 prompt tokens a second
gemma4:26b read 53 prompt tokens at 14.5 tok/s and 4,470 at 6,178.9 on the same RTX 5090 run set. Prompt speed is not one number.