49W Average Hid a 338W Burst on Gemma 26B
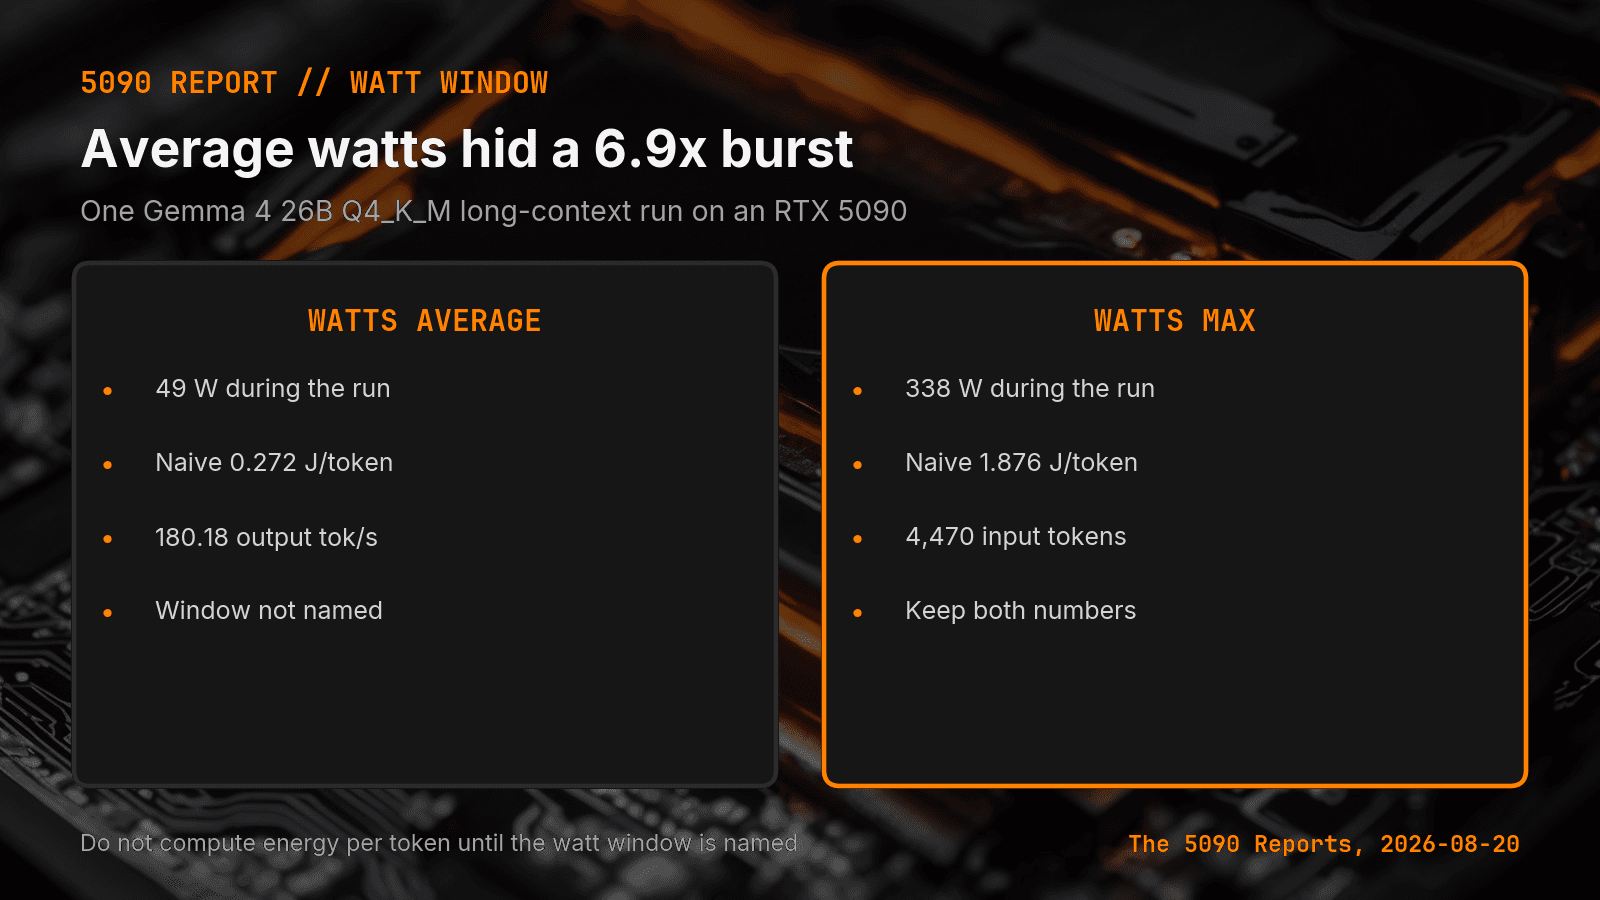
Gemma 4 26B Q4_K_M averaged 49 W on a long RTX 5090 run and peaked at 338 W. Keep both watt numbers before you compute energy per token.
TL;DR
- The August 20, 2026 5090 Report lists three gemma4:26b Q4_K_M rows from Ollama 0.31.1. The long-context-summarize row averaged 49 W and peaked at 338 W at 180.18 tok/s.
- Naive math on this long-context run gives 0.272 joules per output token from the average and 1.876 from the max. Those are not two valid answers. They are one missing window.
- Across these three Q4_K_M rows, the average stayed in a 43-49 W band while the max moved from 187 W to 338 W. nvidia-smi power.draw is a sampled GPU reading, not wall power for the whole PC.
A 49-watt average on my RTX 5090 looked cheap. The same Gemma 4 26B Q4_K_M run peaked at 338 watts.
The short answer: Keep GPU watts average and GPU watts max on the same row. I only divide watts by output tokens per second after I name the sample window. Naive math on this long-context run gives 0.272 joules per output token from the average and 1.876 from the max. Those are not two valid answers. They are one missing window.
Canonical URL: https://bmdpat.com/blog/local-llm-gpu-watt-avg-vs-max-2026
What did the RTX 5090 receipt record?
The August 20, 2026 5090 Report lists three gemma4:26b Q4_K_M rows from Ollama 0.31.1. Each note stores watts avg/max during the run.
| Workload | Input | Output | Output rate | Watts avg / max |
|---|---|---|---|---|
| short-gen-256 | 53 | 256 | 198.81 tok/s | 43 / 187 |
| long-context-summarize | 4,470 | 128 | 180.18 tok/s | 49 / 338 |
| agent-code-task-512 | 76 | 512 | 207.41 tok/s | 48 / 320 |
The long-context row is the loud one. Average power was 49 W. Max power was 338 W. That is a 6.9x gap on one run of one Q4_K_M file.
nvidia-smi reports power.draw as a sampled GPU power reading, not as wall power for the whole PC. I treat it that way. The receipt does not name the sample interval. It also does not say whether idle samples sat in the average.
Why is the average a weak energy input?
On August 24, 2026 I showed how to turn a generation-phase average into joules per output token. Divide watts by output tokens per second. On a different workshop row, num_batch=256 used 187.6 W at 215.7 tok/s, or about 0.870 J per output token. That write-up is How to Calculate Local LLM Energy per Token.
The formula still needs a named window. If I plug the long-context average into the same formula, 49 / 180.18 = 0.272. If I plug the max into it, 338 / 180.18 = 1.876. I round those to three decimal places only for the table. I do not keep either number as the energy result for that row.
The 0.272 figure is 3.2x lower than the workshop 0.870 figure. The 1.876 figure is 2.2x higher. Same GPU. Same 26B class. Different watt windows. A ranking built from those mixed averages would pick a winner for the wrong reason.
How should I use the max reading?
Max power is a burst flag. It is not a substitute average.
338 W on a 575 W card is a real spike. It is not a 49 W workload. I keep the max so a later reader can see that the GPU left the low-power band. I still need a generation-phase average before I compute joules per output token.
The short-gen row shows the same split at a smaller scale: 43 W average, 187 W max, 198.81 tok/s. The agent-code row recorded 48 W average and 320 W max at 207.41 tok/s. Across these three Q4_K_M rows, the average stayed in a 43-49 W band while the max moved from 187 W to 338 W.
I do not know the cause from this receipt. Prompt work, decode work, and idle samples can share one "during run" average. The input and output benchmark split already treats those phases as separate clocks. Power needs the same split.
What belongs in the next power receipt?
Keep the raw pair. Save watts average and watts max. Save the model, quant, runtime, GPU, workload, context, input tokens, output tokens, and output rate. Then name three more fields:
- The sensor (
nvidia-smi power.draw, wall meter, or other). - The sample interval.
- The phase covered (full request, prompt eval only, or generation only).
If any of those three is missing, I can still compare speed and VRAM. I cannot compare energy per token with a row that named the window.
My earlier power-data note argued that speed without watts hides operating cost. This row adds the next trap: watts without a window hides the burst.
For this long-context Gemma run, I keep 49 W and 338 W together. I do not publish a joules-per-token winner from them. The next useful experiment is a generation-only average on the same prompt, with the sample interval written on the row.
Accompanying prompt
What the prompt does: It checks whether a local LLM power row has a named watt window before anyone computes energy per token.
Copy/paste this prompt:
Copy-ready prompt
Paste the exact block into your coding agent.
No article chrome, no footnotes, no formatting drift.
This prompt and every other one we publish live in the free prompt library.
Copy the block above.
Get the next measured local AI build note from The 5090 Reports.
FAQ
What did the RTX 5090 receipt record?
short-gen-256: 43 / 187 W at 198.81 tok/s. long-context-summarize: 49 / 338 W at 180.18 tok/s. agent-code-task-512: 48 / 320 W at 207.41 tok/s. That long-context gap is 6.9x on one Q4_K_M file.
Why is the average a weak energy input?
The formula watts divided by output tokens per second still needs a named sample window. 49 / 180.18 = 0.272 and 338 / 180.18 = 1.876 are not two valid energy results. They mark a missing window.
How should I use the max reading?
Max power is a burst flag. It is not a substitute average. 338 W on a 575 W card is a real spike. Keep the max so a later reader can see that the GPU left the low-power band, then compute joules per token from a generation-phase average.
Get the Local AI Field Kit
Four copy-ready tools now, then one evidence-backed Local AI Lab Note on Friday when there is something worth sharing.
Try the free agent run check firstGet the requested artifact now, then at most one evidence-backed Local AI Lab Note on Friday when there is something worth sharing. One-click unsubscribe. No sponsored placements. Privacy.
Patrick Hughes
I build BMD and publish measured AI runs, failure reports, and reusable checks. Nashville, Tennessee.
More writing
- 5 min
How to Calculate Local LLM Energy per Token
My RTX 5090 test shows how watts and output rate become joules per token, and why the faster of two matched settings can waste energy.
- 5 min
Log Local LLM Fallbacks Before You Score the Output
My local writer hit a host RAM guard, then Sonnet produced a draft that failed QA. Here is how I separate availability, model identity, and useful output.
- 5 min
My local daily brief used 0 model calls
On September 4, 2026 my llama3.1:8b daily brief was ready with 0 model calls and 0 seconds. Preview-only file ranking is not a model run.
- 5 min
Long Context Cost Me VRAM, Not Tokens a Second
A 94x bigger prompt cost llama3.1:8b only 9.7% of its generation rate. VRAM rose 656 MiB, but num_ctx doubled in the same step. Budget memory first.
- 5 min
One model logged 14.5 and 6,178 prompt tokens a second
gemma4:26b read 53 prompt tokens at 14.5 tok/s and 4,470 at 6,178.9 on the same RTX 5090 run set. Prompt speed is not one number.